November 26, 2003
7th floor
7th floor :
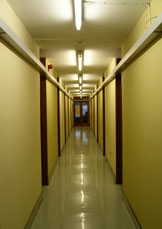
Tranquil, light, long corridors of offices, tables piled with papers and books, blackboards layered with half erased equations, computers blinking unix.
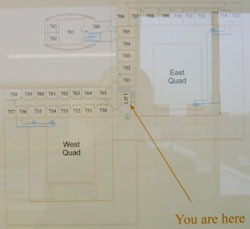
There's a corridor running north - south ; at one end another running to the east, at the south end another running to the west. Quiet and polished, gently humming like a space station, on the walls graphs and Hubble pin ups.
Seen from above it looks like a spiral galaxy and in each office people working.
Intense, quiet energy.
Overheard : 1 / r is shit
November 18, 2003
Hillbilly Astronomy
CMB: a bit of progress in understanding the data. What I want is to consider the universe as a resonant space and see what it sounds like when given a hefty thwack. I thought that I could use the data in this way but not so sure now. The data I have - if I understand it correctly - is a measure of temperature fluctuations against angular resolution of observation.
Temperature fluctuations can be read as amplitude (actually amplitude squared) and angular resolution as wavelength. The wavelength of a particular angular resolution being the length of the section of the circle it describes. As the length of the radius is the age of the universe less 300,000 years that's going to be pretty large.
So I'm going to interpret the data as amplitude v frequency, ie an FFT of the snapshot of the universe at the point that the CMB is frozen. I just have to figure out the small detail of how to put it into an IFFT and see what sound comes out. Probably be really boring and rubbish. No matter.
According to my logic, that will be the sound signature - or a sound signature - of the CMB. If one reads about the CMB then one discovers that data is interpreted as acoustic phenomana :
What we actually see is the pattern of the sound waves that is imprinted on the temperature of the CMB.
Compressing a gas heats it up. Letting it expand cools it down. The CMB is locally hotter in regions where the acoustic wave causes compression and cooler where it causes rarefaction.
. . . according to the website.
Band : there are now several members; a couple of guitars, cello, bass, banjo, vocals. The idea is to keep it to members of the department and use material relating to Astrophysics through its title. Telstar, Satellite of Love, Fly me to the Moon, Starman, The Yellow Moon of Texas, Blue Moon of Kentucky . . . . .
The Pulsars, The Astrophysicists, Cygnus X1, The Oxford Pulsars . . . .
Little Universes: made the first little universe, a small cube mirrored on the inside.
Hillbilly Astronomy: making enquiries into the hows, whys and wherefores of building equipment to make astronomical observations using cheap household materials and jumk.
What I have in mind at the minute is to build a large radio telescope, Jodrell Bank style, out of cardboard, tinfoil, radios and tvs. First though I'll start small.
Attended a seminar about merging elliptical galaxies which was pretty comprehensible except for some of the maths.
November 6, 2003
Confusion * 2
Confusion #1: the assertion that were the universe to start contracting, the arrow of time would be reversed and thus we would see everything running backwards . . . and . . . something contracting viewed backwards appears to expand, so everything would just look the way it does anyway.
Confusion #2: trying to make sense of the CMB data.
Been talking to D about starting a band within the department.
November 3, 2003
The Angular Power Spectrum
The patterns in the cosmic microwave background are due to random processes, set up in the very early universe. As if at some early time, the universe became agitated, like a cauldron of boiling water and started to slosh around. But unlike with the boiling cauldron, we are not entirely sure about the origin of this randomness. Most cosmologists now believe that it is an imprint of quantum noise from the very beginning of time. It is a clean, elegant hypothesis but has not been completely confirmed. To describe random processes we need to use a branch of mathematics known as statistics. Instead of describing a random process in terms of the exact values that it takes at any point in space or time, we talk about the probability of taking a given value. Let us think of a simple example, the surface of an ocean or a lake. Suppose the water is very rough with waves and a lot of activity. We may be able to say that the average height of the waves is, for example one metre. This means that if we look at all the waves and measure their heights, we will find that there are a few very small ones and a few very big ones, but most of the waves have a height of about one metre. The average height of the waves is a statistical measure of the roughness of the surface of the water. But we might also like to ask how big the waves are, or how much of the surface of the water does a typical wave take up? This is different from the height of the wave. For example one might have very small, but high waves which look choppy. Or one might have very long waves and high waves. Or even very long and shallow waves. We then need to characterize the average spatial extent of the waves. Or even better, the average heights of waves of a given spatial extent. For example we may find that long waves that cover an appreciable part of the surface of the water are normally very shallow. Or that small waves that pop in and out of existence normally do so with gusto and are very high. The average height of the waves as a function of spatial extent will contain this information. Or to be more accurate the range in heights of waves as a function of spatial extent will tell us what are the typical sizes we may extent when we look at the surface of the sea.
Little Universes
Walked around Oxford with Janna and talked about how we could make little universes out of mirrors. We wandered round the Ruskin School of Art (where she's scientist in residence) and back to Astrophysics.
She also filled me in on more details about pulsars. Not so sure it will be possible to make one. Now I know that they're neutron stars with an iron core and a density so great that one teaspoon of pulsar matter weighs a billion tons, beaming out a cone of radiation from their poles. It's that beam that creates the pulse, flashing like a lighthouse each time a pole spins past our field of vision.
Talked to Jo Dunkley about Cosmic Microwave Background (CMB) and what form the data took, with a view to an experiment in mapping it to sound. Basic data is made up simple of points on the inside of a sphere and temperature. JD reckoned that for my purposes it was better to use angular power spectrum data. Trying to get my head round what that quite means ! Anyway, she emailed me this graph and it's data which I'll experiment with in SuperCollider.